
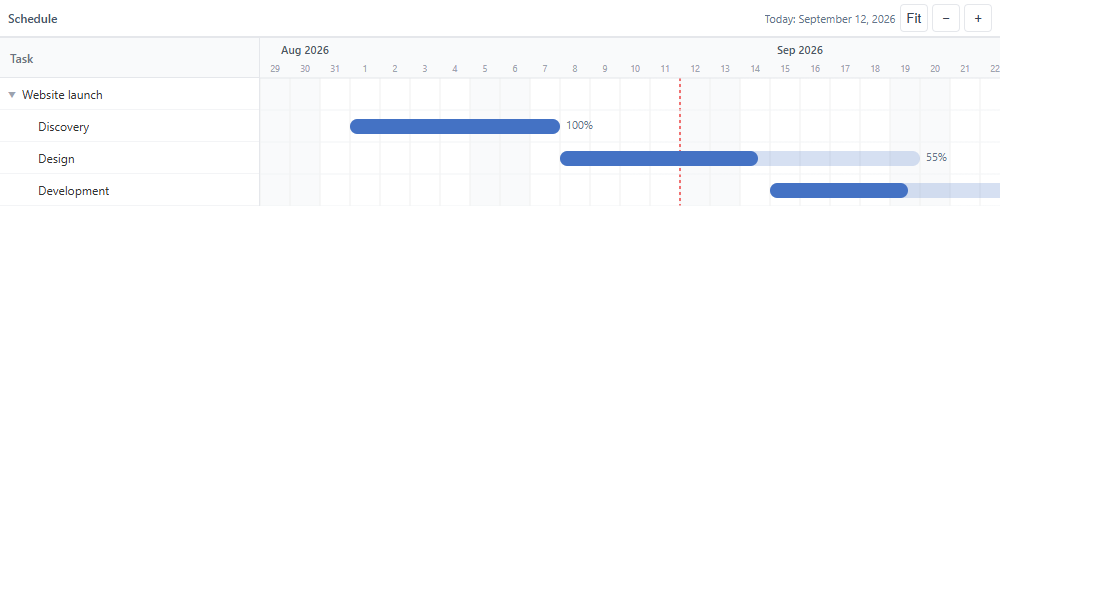
Five-level hierarchy
Shows project, phase, task, subtask and activity in one unified view.

Power BI Visuals
Add an offline hierarchical Gantt chart to Power BI with both LTR and RTL layouts.
GanttChart Visual is built for teams that need to display plans, phases, tasks and activities directly inside Power BI without depending on online services. The focus is on a clear, structured and readable planning experience.
The visual supports up to five hierarchy levels and is suitable for project management, roadmaps, operational scheduling and progress reporting. Support for Gregorian, Jalali and Hijri calendars plus LTR/RTL layout makes it flexible for multilingual and regional environments.
Shows project, phase, task, subtask and activity in one unified view.
Switch between left-to-right and right-to-left layouts for different teams and languages.
Display dates using Gregorian, Jalali or Hijri calendars without external dependencies.
No runtime fetch, external scripts or remote fonts — suitable for controlled environments.
Contact us if you want more information or a version suited to your organization.